


Introduction
This methodological note outlines defines several LinkedIn metrics developed to understand and monitor AI workforce trends. This body of work represents the world seen through LinkedIn data, drawn from the anonymised and aggregated profile information of LinkedIn’s 1.3+ billion members around the world. As such, it is influenced by how members choose to use the platform, which can vary based on professional, social, and regional culture, as well as overall site availability and accessibility. All data show aggregated information for the corresponding period following strict data quality thresholds that prevent disclosing any information about specific individuals.
Country sample
Included countries represent a select sample of eligible countries with at least 40% labour force coverage by LinkedIn and at least 10 AI hires in any given month. India was included in this sample because of its increasing importance in the global economy, but its LinkedIn coverage does not reach 40% of the workforce. Insights for India may not provide as full a picture as other countries and should be interpreted accordingly.
AI skills
LinkedIn members self-report their skills on their LinkedIn profiles. Currently, more than 42 000 distinct, standardised skills are identified by LinkedIn.
LinkedIn categorises AI skills into 2 mutually exclusive groups: “AI Engineering” and “AI Literacy” skills, where, broadly, AI Engineering skills refer to the technical expertise and practical competencies required to design, develop, deploy, and maintain artificial intelligence systems, and AI Literacy skills refer to the knowledge, abilities, and critical thinking competencies needed to understand, evaluate, and effectively interact with AI technologies. As skills are ever evolving LinkedIn maintains and refreshes these classifications on a periodic basis.
Skill groupings are derived by expert taxonomists through a similarity-index methodology that measures skill composition at the industry level. Industries are classified according to the ISIC 4 industry classification (Zhu et al., 2018).
The top skills that comprise the “AI engineering” skill grouping are machine learning, natural language processing, artificial intelligence, computer vision, image processing, deep learning, TensorFlow, and OpenCV, among others. The skills that comprise the “AI literacy” grouping are prompt engineering, GPT-3, GPT-4, stable diffusion, ChatGPT, Github copilot, generative art, Dall-E, Midjourney and Google Bard.
AI jobs or occupations
LinkedIn member titles are standardised and grouped into over 16,000 occupations. These are not sector or country specific. An AI job is an occupation that requires AI skills to perform the job. Examples of such occupations include (but are not limited to): machine learning engineer, artificial intelligence specialist, data scientist, computer vision engineer etc.
AI talent
A LinkedIn member is considered AI talent if they have explicitly added at least two AI engineering skills to their profile and/or they are or have been employed in an AI job. A LinkedIn member is considered AI literate
if they have added at least one AI literacy skill to their profile.
Methodology
Skills genome
For any entity (occupation or job, country, sector, etc.), the skill genome is an ordered list (a vector) of the 50 ‘most characteristic skills’ of that entity. A TF-IDF algorithm – short for ‘term frequency–inverse document frequency’ – is used to identify the most representative skills of each entity and down-rank ubiquitous skills that add little information about that specific entity (e.g. Microsoft Word).
TF-IDF is a statistical measure that evaluates how important a word is to a document in a collection or corpus of documents (Rajaraman and Ullman, 2011). In this case, the TF-IDF algorithm is used to evaluate how representative a skill is to a selected entity. This is done by multiplying two metrics:
- The term frequency of a skill in an entity (‘TF’).
- The logarithmic inverse entity frequency of the skill across a set of entities (‘IDF’). This indicates how common or rare a word is in the entire entity set. The closer IDF is to 0, the more common a word is.
If the skill is very common across LinkedIn entities, and appears in many job or member descriptions, the IDF will approach 0. If, on the other hand, the skill is unique to specific entities, the IDF will approach 1. More details are available at LinkedIn’s Skills Genome and LinkedIn-World Bank Methodology.
AI skills penetration
The aim of this indicator is to measure the intensity of AI skills in an entity (in a particular country, industry,gender, etc.) through the following methodology:
- Compute frequencies for all self-added skills by LinkedIn members in a given entity (occupation, industry, etc.) from 2015 onwards.
- Re-weight skill frequencies using a TF-IDF model to get the top 50 most representative skills in that entity. These 50 skills compose the “skill genome” of that entity.
- Compute the share of skills that belong to the AI skill group out of the top skills in the selected entity.
Skills penetration is used as a signal for whether AI skills are prevalent in an occupation representative, in any sector where the occupation representative may exist. Examples of such occupations include Machine Learning Engineer, Artificial Intelligence Specialist, Data Scientist, and Computer Vision Engineer.
Interpretation: The AI skill penetration rate signals the prevalence of AI skills across occupations, or the intensity with which LinkedIn members utilise AI skills in their jobs. For example, the top 50 skills for the occupation of “Engineer” are calculated based on the weighted frequency with which they appear in LinkedIn members’ profiles. If four of the skills that engineers possess belong to the AI skill group, then this measure indicates that the penetration of AI skills is estimated to be 8% among engineers (i.e. 4/50).
Relative AI skills penetration
To allow for skills penetration comparisons across countries, the skills genomes are calculated and compared to the global average. A ratio is then constructed between a country’s AI skills penetrations and the global average, controlling for occupations.
Note that a country’s AI penetration is benchmarked by considering only the overlapping occupations between this country and the global average set. For example, if Peru has only 2 occupations with AI skills, we calculate the global average using only those two occupations.
Interpretation: A country’s relative AI skills penetration of 1.5 indicates that AI skills are 1.5 times as frequent as the global average, for an overlapping set of occupations.
Relative AI skills penetration by country
For cross-country comparison, the relative penetration rate of AI skills is measured as the sum of the penetration of each AI skill across occupations in a given country, divided by the average global penetration of AI skills across the overlapping occupations in a sample of countries.
Interpretation: A relative penetration rate of 2 means that the average penetration of AI skills in that country is two times the global average across the same set of occupations.
Relative AI skills penetration by industry
The relative AI skills penetration by country and industry provides an in-depth sectoral decomposition of AI skill penetration across industries and sample countries.
Interpretation: A country’s relative AI skill penetration rate of 2 in the education sector means that
the average penetration of AI skills in that country is two times the global average across the same set of
occupations in that sector.
Relative AI skills penetration by gender
The relative AI skills penetration by country and gender provides an in-depth sectoral decomposition of AI skill penetration across genders and sample countries.
Interpretation: A country’s AI skills penetration for women of 1.5 means that members who are
women in that country are 1.5x more likely to list AI skills than the average female member in all countries
pooled together across the same set of occupations that exist in the country-gender combination.
Top AI skills
AI skills most frequently added by members in 2025 by country.
Fastest growing AI skills
Top fastest growing “AI engineering” and “AI literacy” skills (year-over-year growth rates) in LinkedIn member profiles, by country. A threshold is applied such that only AI skills with skill-add volumes at or above the 50th percentile of the most recent year’s distribution within each country are included.
Top AI occupations
This metric identifies the most common AI occupations by country. Occupations are ranked based on the share of members who list an AI occupation on their profile in the latest available month. The data is provided for AI engineering skills in 2025, by country.
AI job postings
This metric measures employer demand for AI talent by calculating the share of job postings that qualify as AI
roles by country and month. A job posting is labelled as requiring AI talent if it either (i) lists at least two AI
engineering skills, or (ii) is associated with an AI occupation. Talent demand is defined as the proportion of all
job postings in a country that meet these criteria.
Interpretation: In Germany, AI Engineering job accounted for 1.5% of all job postings in December 2025.
AI talent concentration
The counts of AI talent are used to calculate talent concentration metrics. For example, AI talent concentration at the country level is calculated using the counts of AI talent vis-a-vis the counts of LinkedIn members in that country. As such, AI talent concentration metrics may be influenced by a country’s LinkedIn coverage and should be used with caution.
Since it also encompasses LinkedIn members with AI job titles – as opposed to only LinkedIn members with AI skills on their profiles – AI talent is considered to be a more comprehensive measure than AI skills.
AI talent migration
Data on AI skills migration comes from the World Bank Group-LinkedIn “Digital Data for Development” partnership. Please see https://linkedindata.worldbank.org/ and Zhu et al. (2018) for more information.
LinkedIn migration rates are derived from the self-identified locations of LinkedIn member profiles. For example, when a LinkedIn member updates his or her location from Paris to London, this is counted as a migration. Migration data is available from 2021 onwards.
LinkedIn data provide insights to countries on the AI talent gained or lost due to migration trends. AI Talent migration is considered for all members with AI skills/holding AI jobs at time t for country A as the country of interest and country B as the source of inflows and destination for outflows. Thus, net AI Talent migration between country A and country B – for country A – is calculated as follows:
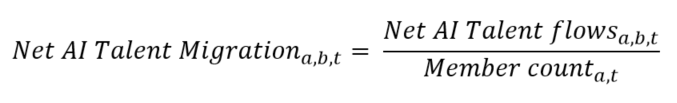
Net flows are defined as total arrivals minus departures within the given time period. LinkedIn membership varies considerably between countries, which makes interpreting absolute movements of members from one country to another difficult. To compare migration flows between countries fairly, migration flows are normalised for the country of interest. For example, if country A is the country of interest, all absolute net flows into and out of country A, regardless of origin and destination countries, are normalised based on LinkedIn membership in country A at the end of each year and multiplied by 10 000. Hence, this metric indicates relative talent migration from all countries to and from country A.
From 2023 onwards, AI skills have been divided into “AI engineering” and “AI literacy” skills, as described above. Only the AI engineering skills are considered to compute AI talent migration indicators.
Relative AI hiring index
The AI hiring over time chart on OECD.AI indicates the rate of hiring in the AI field for each country, compared to the overall hiring in that country.
The LinkedIn hiring rate is a measure of hires normalised by LinkedIn membership. It is computed as the percentage of LinkedIn members who added a new employer in the same period the job began, divided by the total number of LinkedIn members in the corresponding location.
The AI hiring rate is computed utilising the overall hiring rate methodology, but only considering members classified as AI talent. The relative AI talent hiring rate YoY ratio is the year-over-year change in the AI hiring rate relative to the overall hiring rate in the same country. A 3-month moving average is displayed.
Interpretation: The Relative AI Hiring Index shows how fast each country is experiencing growth in AI talent hiring relative to growth in overall hiring in the country. A rate of 20% means that the ratio of AI talent hiring relative to overall hiring has grown 20% year-over-year.
Career transitions into AI jobs
The data on career transition shows the share of transitions from any job occupation into AI jobs pooled over a five-year period. Career transitions are computed by aggregating member-level job transitions from one occupation to another occupation that the member has never previously held. To note, first occupations by new graduates and transitions within the same occupation are excluded from this indicator.
LinkedIn member titles are standardised and grouped into over 16,000 occupations. For the purpose of simplifying the career transition visualisations, some of these occupations have been grouped into broader categories:
- Machine learning engineer, machine learning specialist, machine learning researcher and machine learning consultant as machine learning expert;
- Data science specialist, data science manager, director data science, data science researcher and computational scientist as data scientist;
- Deep learning engineer and deep learning researcher as deep learning specialist;
- Data miner and data mining engineer as data mining specialist;
- Artificial intelligence specialist and generative AI engineer as artificial intelligence engineer;
- Bioinformatics engineer, bioinformatics specialist, computational biologist and bioinformatics analyst as bioinformatician;
- Statistical analyst, statistical researcher, research statistician, statistical consultant and survey statistician as statistician;
- Web development specialist and web application developer as web developer;
- Java software engineer, embedded software engineer, system software engineer, software engineering analyst, software engineering specialist, software engineering consultant and software engineering technician as software engineer;
- Business intelligence consultant, business intelligence developer, business intelligence engineer and business intelligence expert as business intelligence specialist;
- Data warehouse engineer, data warehouse architect and data warehouse consultant as data warehouse specialist;
- Database developer, database analyst, Oracle database administrator, SQL database administrator and database administrator as database specialist;
- Data steward, data coordinator, data administrator, data officer and data supervisor as data manager;
- ETL consultant and ETL developer as ETL specialist;
- Automation engineer, automation developer, automation consultant and automation analyst as automation specialist.
In addition, only the top 24 most prominent source occupations and destination, AI occupations, per country, are displayed. The remaining ones are grouped under “Other”.
Interpretation: In the United-States, 26.9% of transitions into AI Engineer came from Software Engineers. Please note that minimum thresholds have been applied, this indicator only captures countries which have at least 3 country/occupation transition pairs and includes transitions with sufficient sample size.
Proportion of AI talent by gender
The proportion of AI talent by gender shows the percentage of AI talents which are female and male individuals. This indicator is computed yearly at a global and country level and includes industry aggregates.
Interpretation: The share of female AI talent with AI Engineering skills is 30.5% globally in 2024, up from 29.3% in 2016. Please note that this indicator only includes countries with more than 100 thousand LinkedIn members and that have a gender coverage which is at least of 67%.
For more information on the methodological note please see LinkedIn Economic Graph’s technical note on the methodology used for LinkedIn’s AI Data Partnerships.
References
Rajaraman, A. and Ullman, J. (2011), Mining of Massive Datasets, pp. 1–17, https://doi.org/10.1017%2FCBO9781139058452.002, ISBN 978-1-139-05845-2.
Zhu, T.; Fritzler, A.; and Orlowski, J. (2018). World Bank Group-LinkedIn Data Insights: Jobs, Skills and Migration Trends Methodology and Validation Results (English). Washington, D.C.: World Bank Group. http://documents.worldbank.org/curated/en/827991542143093021/World-Bank-Group-LinkedIn-Data-Insights-Jobs-Skills-and-Migration-Trends-Methodology-and-Validation-Results.