How people are using GenAI chatbots: Evidence from web traffic data


Tracking the uptake of artificial intelligence (AI) poses a fundamental measurement challenge. Recent data, such as Eurostat’s survey, are useful but often limited in geographic and chronological coverage and can be difficult to adjust as technologies change. Given that AI usage is evolving rapidly, frequently updated data sources can help us understand the dynamics and address data gaps.
To measure AI usage in real time, the OECD.AI team has developed an approach that leverages web traffic data. Platforms such as Similarweb provide estimates of website and app visitors, offering a window into how users interact with digital services at scale. This web traffic data enables researchers to track usage trends for AI chatbot interfaces and services.
While these data should be interpreted with appropriate methodological caveats, they offer unique insights into real-time dynamics of how the public is using AI.
A new measure of AI chatbot usage
To build a measure of monthly usage of GenAI chatbots, we focus on direct user engagement through AI web interfaces. It uses the number of unique, deduplicated visitors over a two-year period between 1 February 2024 and 30 March 2026 to the three main AI chatbot websites, ChatGPT, Claude and Gemini. According to the data, these three sites account for essentially all web traffic to chatbot interfaces in GPAI countries, as users of other sites will almost always also use one of the three leading sites and would therefore be removed during the deduplication process anyway.
With the number of unique visitors across the three chatbots, divided by population from IMF projections, the new measure of GenAI chatbot usage is computed.
There are a few methodological limitations to this approach as a proxy for broader AI adoption. This metric focuses on consumers, capturing only AI chatbot usage, and therefore excludes embedded or API-based uses of AI, which are increasingly central to enterprise applications and productivity-enhancing workflows. Additionally, web traffic data may be difficult to estimate for smaller jurisdictions and may introduce some bias into the country-level data. The estimates rely entirely on SimilarWeb data collection, which is subject to its own panel and estimation biases.
GenAI chatbot usage has grown rapidly
Across GPAI countries, this new measure of GenAI chatbot usage has surged over the past year, from roughly 18% of the population, on average, in January 2025 to 28% in January 2026. The countries seeing the highest growth in this measure in 2025 were Japan and Türkiye, where usage rates more than doubled. Singapore is consistently the top user per capita, and also experienced the largest increase in absolute terms, rising from 36% to 63% of the population using AI chatbots in 2025. You can explore the data for yourself in (Figure 1).
Figure 1. GenAI chatbot usage rates between February 2024 and March 2026
Notes: Costa Rica, Estonia, Iceland, Latvia, Lithuania, Luxembourg, Malta, Senegal, Slovenia missing due to insufficient data. GenAI usage rates use deduplicated unique visitors from ChatGPT, Claude, and Gemini. Sources: OECD.AI calculations using data from SimilarWeb and the IMF.
The intensity of use among GenAI chatbot users has also grown. Figure 2 shows that in mid-2024, the average visit length to AI chatbots across GPAI countries was about 4.5 minutes. This grew to over 5.5 minutes in early 2026, signalling more intensive consumer use.
Figure 2. Average visit duration to AI chatbots in seconds
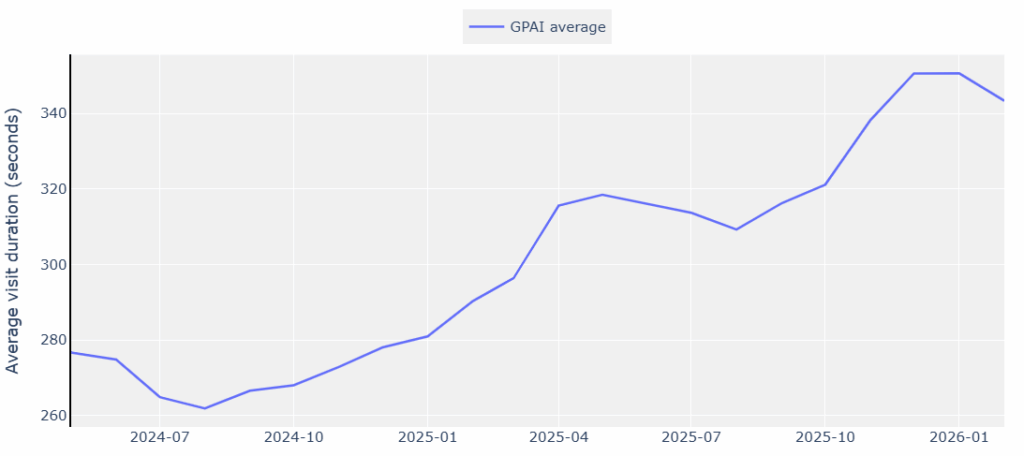
Source: OECD.AI calculations using data from SimilarWeb.
GenAI chatbot use demographics
Younger audiences use AI chatbots the most. A deeper look at the data provides a better understanding of the demographics of AI users. First, GenAI chatbot usage remains much higher among younger consumers. According to the data, over half of people aged 25-34 in February 2026 used GenAI chatbots across GPAI countries, while only about 8% of people aged 65 and over were chatbot users (Figure 3).
Figure 3. GenAI adoption rate by age group
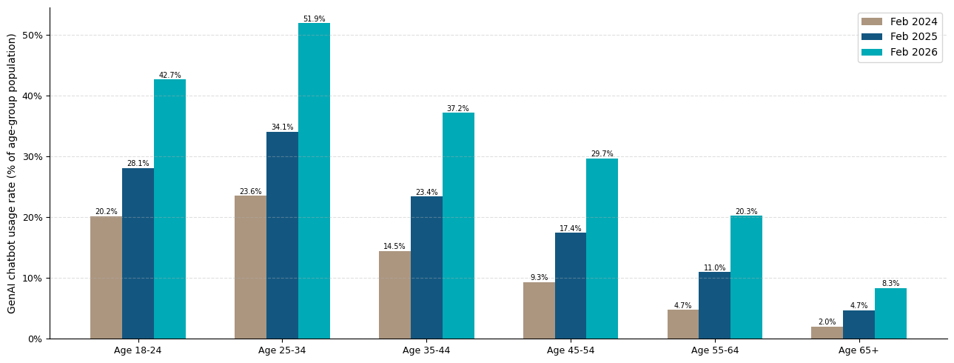
Sources: OECD.AI calculations using data from SimilarWeb, IMF and OECD Population Statistics database.
Usage among older consumers accounts for much of the recent growth. While individuals under 35 still account for more than half of all GenAI chatbot users in 2026, their share has gradually declined. Between February 2024 and February 2026, the share of visitors aged 35 and over increased from 38% to 48%. This suggests that much of the recent growth in AI chatbot adoption has been driven by older age groups, indicating that usage is becoming more mainstream and widespread across the broader population (Figure 4).
Figure 4. Age distribution of AI users
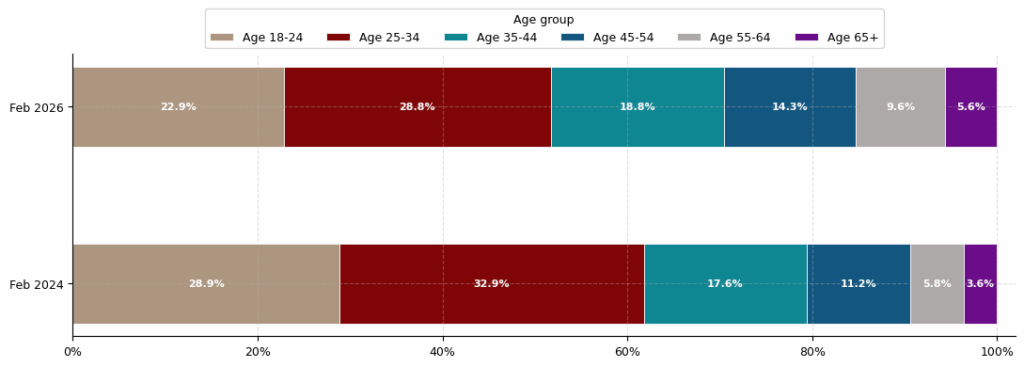
Source: OECD.AI calculations using data from SimilarWeb.
Recreational AI use and younger populations. Looking beyond the three most popular AI chatbots, the data show that usage varies widely across age groups. Figure 5 shows that people under the age of 25 are much more likely to use Character.AI (a free chatbot that lets you create digital characters and interact with them via text, voice messages and calls) than any other chatbot. This indicates more recreational use among that age group. Older age groups, by contrast, are much more likely to use Microsoft Copilot, perhaps due to built-in referrals and employer-funded subscriptions.
Figure 5. Share of AI Chatbot usage by age groups
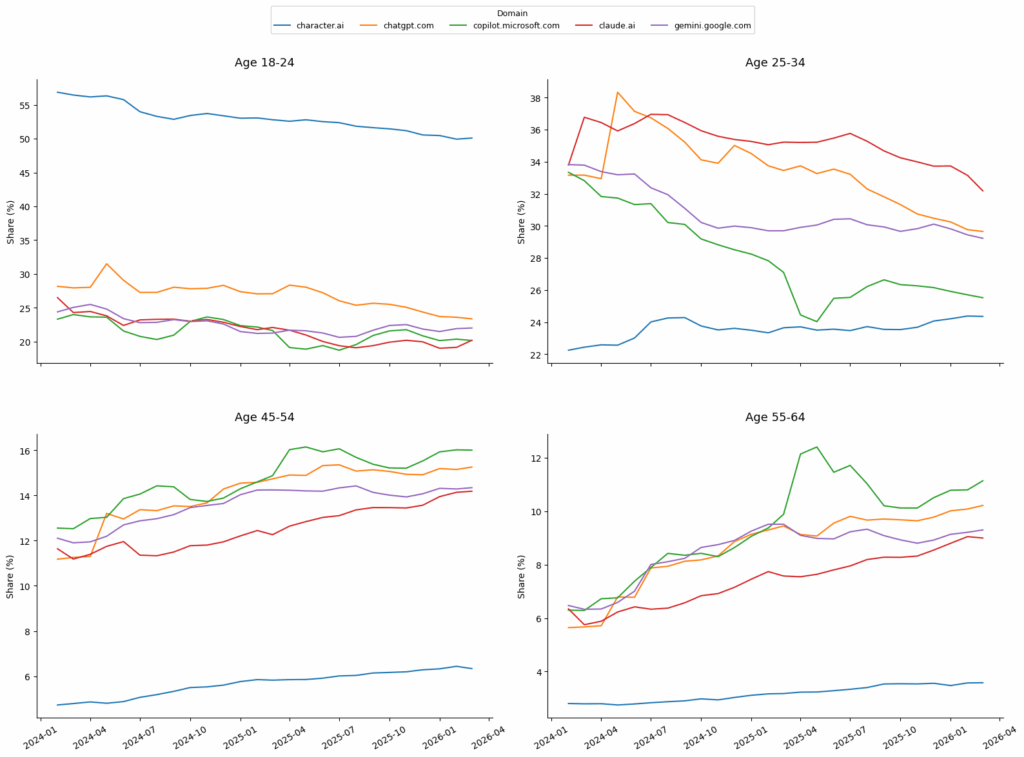
Source: OECD.AI calculations using data from SimilarWeb.
Different chatbots, different jobs
Browsing patterns also indicate differences in how AI chatbots are used. Users of ChatGPT and Gemini are more likely to also visit recreational-oriented platforms such as YouTube, Instagram, and Facebook. In contrast, users of Claude and Microsoft Copilot more frequently visit sites such as LinkedIn, cloud platforms, Notion, and GitHub. This suggests that Claude and Copilot users are concentrated in professional settings, particularly for workplace productivity and coding-related tasks (Table 1). The use of Copilot, in particular, seems to be largely driven by Microsoft’s own ecosystem.
Table 1. Most relevant domains for users of top chatbots for 2025
| Relevance score ranks | chatgpt.com | gemini.google.com | copilot.microsoft.com | claude.ai |
| 1 | google.com | reddit.com | bing.com | github.com |
| 2 | youtube.com | instagram.com | login.live.com | stackoverflow.com |
| 3 | instagram.com | youtube.com | msn.com | notion.so |
| 4 | reddit.com | github.com | m365.cloud.microsoft | aistudio.google.com |
| 5 | facebook.com | facebook.com | github.com | linkedin.com |
Source: OECD.AI calculations using data from SimilarWeb.
Men are more likely to use GenAI chatbots, but numbers differ by country. For the most part, men use GenAI chatbots at a higher rate than women across GPAI countries, although the gap is relatively small (Figure 6). Over time, the gap has fluctuated: decreasing in 2025 before expanding again in 2026. These variations are largely due to country-specific changes: throughout 2024, there was a rapid increase in female adoption in Finland, the Czech Republic, New Zealand, Denmark and Hungary, while in 2025, there was a relatively faster increase in male adoption in Korea, the United States, Norway, Germany and Türkiye.
Figure 6. GenAI usage rate by gender
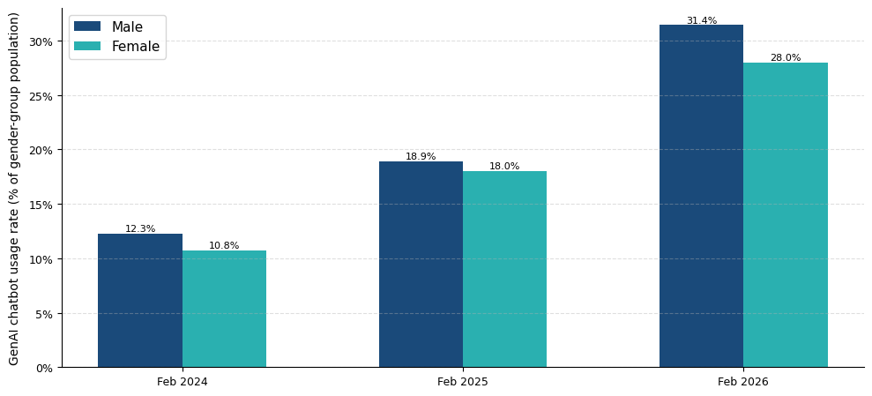
Sources: OECD.AI calculations using data from SimilarWeb, IMF and OECD Population Statistics database.
However, some countries display more pronounced differences: Korea shows the largest gender gap, with male usage rates nearly double those of women. Germany and Italy also show significantly higher usage among men. By contrast, Singapore, the GPAI country with the highest overall usage rate, and Colombia, the Czech Republic, Finland, Hungary, Ireland, Mexico, New Zealand, and Saudi Arabia are the countries where female users adopt AI chatbots at a higher rate than male users (Figure 7).
Figure 7. Male and female AI usage rates by country
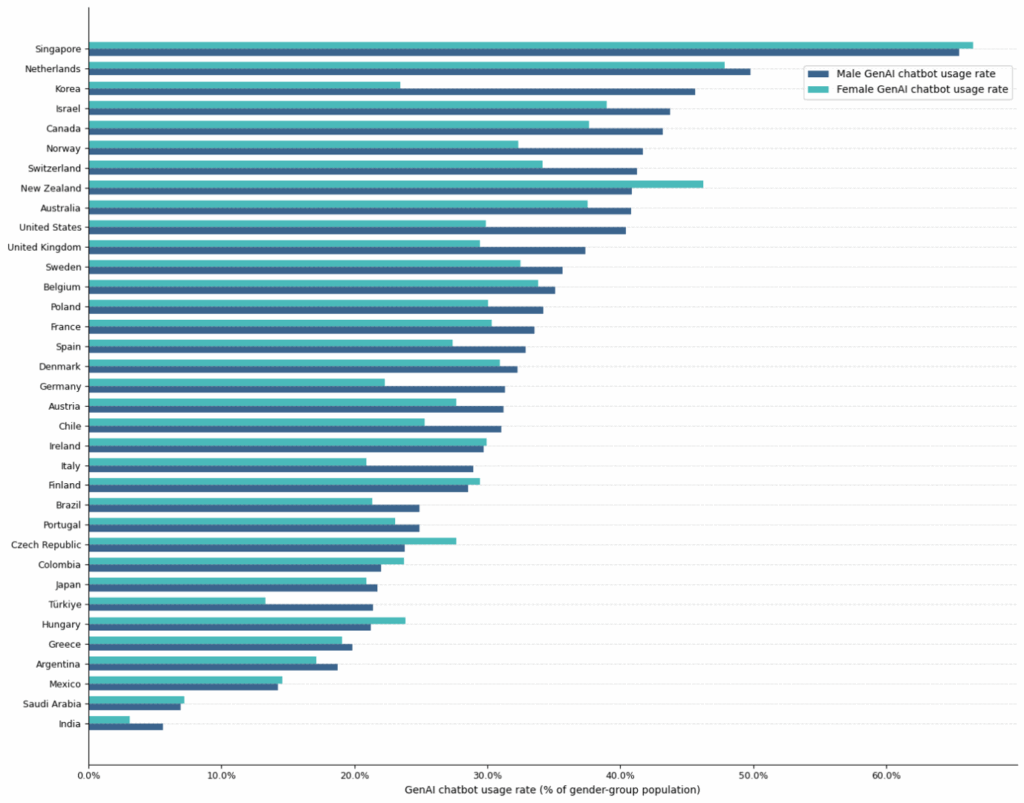
Sources: OECD.AI calculations using data from SimilarWeb, IMF and OECD Population Statistics database.
How trustworthy are these estimates?
GenAI usage rates by country in this analysis are broadly in line with other measures of GenAI tool usage, such as the Eurostat survey and the Microsoft AI Economy Institute (Figure 8). In 2025, Eurostat estimated that just under 33% of people aged 16-74 in the EU had used generative AI tools in the past 3 months. Microsoft’s AI Economy Institute found an average usage rate of 30% over GPAI countries for which data are available. In our estimates, we find that 27% of the total population has used AI on average over the last quarter of 2025. Overall, our measure is strongly aligned with these benchmarks, with a statistically significant correlation of 0.63 with Eurostat estimates and an even stronger correlation of 0.78 with Microsoft’s estimates.
Figure 8. SimilarWeb GenAI usage rates correlate strongly with other estimates and offer broad coverage
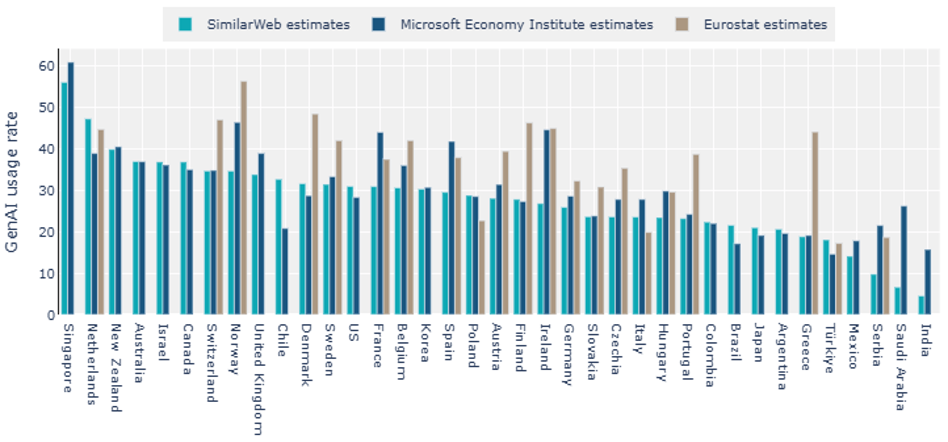
Sources: Microsoft AI Economy Institute, Eurostat survey, SimilarWeb, IMF and OECD.AI calculations.
As AI use becomes mainstream, usage data across countries and demographic groups provide broad insights
Taken together, these results give us a clearer view of GenAI usage and how the picture is evolving. Usage is no longer niche. In just a year, GenAI chatbot use jumped from under a fifth to almost a third of the population across GPAI countries, with countries like Singapore and the Netherlands already seeing usage rates close to or above 50%. At the same time, differences in aggregate use between countries remain significant and warrant closer attention.
AI is also moving beyond its early adopters. While younger users still lead, much of the recent growth is coming from people over 35, signalling that chatbots are becoming mainstream. At the same time, usage is not uniform: some users engage with AI for recreational purposes, while others integrate it into productivity, coding, and workplace tasks. Gender gaps exist as well, but vary widely across countries, highlighting the importance of local context.
Traditional surveys remain essential but provide snapshots and are difficult to adjust to the pace of AI change. Web traffic data helps fill that gap by showing real-time GenAI usage data, how it shifts over time, and how patterns differ across countries and groups. Combined with other indicators on OECD.AI, these data provide a more complete and timely picture of AI diffusion and uptake.
Methodological considerations
SimilarWeb’s data comes from several sources:
- An anonymised panel of millions of Internet users with URL tracking enabled and some demographic information
- Partnerships with websites and data aggregators to directly share data on website analytics
- Online resources and public information
Our analysis relies largely on SimilarWeb’s “unique visitors” metric, defined as the total number of distinct users visiting a domain in each month. This approach involves a deduplication process that accounts for the shared visitors from each of the three most popular chatbots. ChatGPT unique visitors were spliced to account for the domain transition from openai.com. The estimates cover the vast majority of users, as users of other chatbots typically also visit one of the three captured here, and would therefore almost always be removed during the deduplication process.
These data cover the period from February 2024 to March 2026, a timeframe that captures significant developments in the AI landscape. The analysis is also further scoped down to the 37 Global Partnership on AI (GPAI) countries available on the SimilarWeb platform (see https://oecd.ai/en/about/about-gpai for more information on GPAI). As of this analysis, these countries are Argentina, Australia, Austria, Belgium, Brazil, Canada, Chile, Colombia, Czechia, Denmark, Finland, France, Germany, Greece, Hungary, India, Ireland, Israel, Italy, Japan, Korea, Mexico, Netherlands, New Zealand, Norway, Poland, Portugal, Saudi Arabia, Serbia, Singapore, Slovak Republic, Spain, Sweden, Switzerland, Türkiye, United Kingdom, and the United States.
The lower adoption rates in the SimilarWeb estimates when compared to other estimates mainly reflect differences in how each source defines an AI user. First, in the Eurostat data, the distinction is not made on how the user is accessing AI and is therefore considered a broader indicator than our SimilarWeb approach, which focuses solely on AI chatbots accessed via the website (i.e. not including App users). For example, respondents to the Eurostat survey may consider the AI summaries given after Google queries to be a use of generative AI, but is not captured in our measure. Secondly, someone counts as an AI user if they used AI at least once in the past three months in the Eurostat survey, while Microsoft uses a six-month window. Our measure takes the monthly average, which means that a person who visits a chatbot only once during the three-month period (to align with Eurostat) contributes less than someone who uses AI regularly.
Ultimately, each source comes with its own strengths and limitations:
- Survey-based measures such as Eurostat have good statistical adjustments to account for demographics but can be affected by response biases and sampling uncertainty.
- Microsoft has access to real-time, proprietary AI use data, but their estimates rely on assumptions about market share and internet penetration to scale their data.
- SimilarWeb has broad geographical coverage and is based on real click-based data, but it also captures only chatbot usage and relies partly on panel-based web traffic data and its own modelling assumptions, which may be biased.
Taken together, the differences highlight why no single measure currently captures AI adoption on its own. Our new GenAI usage estimates provide a valuable perspective: a timely, internationally comparable indicator that helps track users, their demographics, and how regularly they engage with AI chatbots in practice.